
ShoreBase
started out in 1996 as the BoatHouse. It was hosted via
BTInternet, and was developed using a variety of
tools, as shown below.
It was renamed in November 2000 to shorebase and moved to it's own domain
(ShoreBase.co.uk) to enable the use of 'server side activity'
via ASP pages.
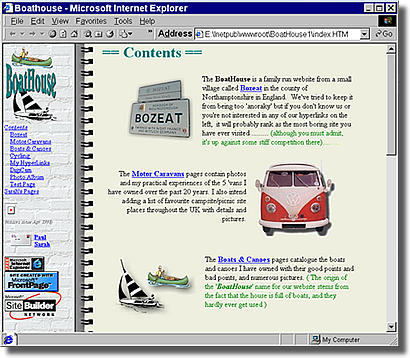 |
The original BoatHouse site was frame based and developed in Frontpage 98. I never realised at the time, but it couldn't even be loaded via Netscape ! In those days, Frontpage used many non-compatible add-ons like 'webbots' to control hyperlinks on image maps |
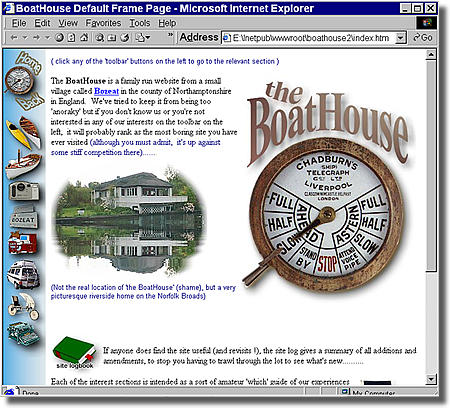
Then a big redesign, still using FP98 and frames, but now starting to use java applets (the 'ripple effect' as used on the home page of this version. The graphics were largely developed using Microsoft's Image Composer v1.5 which came free with Frontpage 98. |
 |
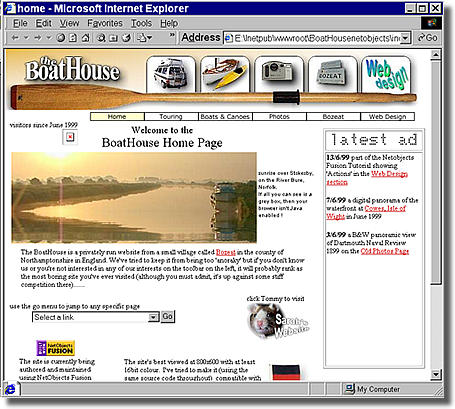 |
Then the shift over to Netobjects Fusion V3 and then V4. I abandoned the frames and went for shared borders. This gave two advantages, more screen 'real estate' after scrolling downwards, and no danger of someone loading a sub page without the frameset (and not seeing any menu panels etc.) Netobjects was a wonderful package for getting a very quick, professional looking result (with it's 'themes'). The problem though, was that the site 'source' was effectively stored in a 'nod' file, and manipulation of the raw HTML was severely hampered. |
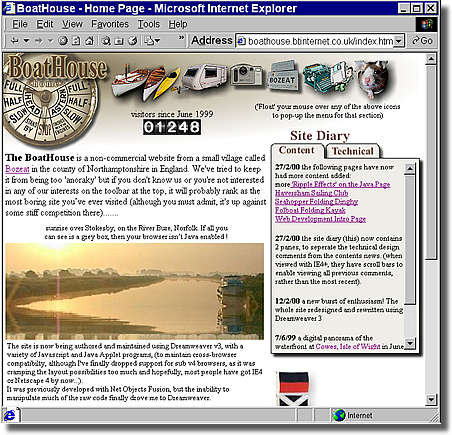
The last Boathouse website was developed using Macromedia's Dreamweaver 3 and Fireworks 3 for the graphics. The whole site used a single template which handled all of the navigation via mouseovers on the graphic at the top of each page. I tried out sub-panels which acted as mini 'site maps' to (hopefully) make the layout more intuitive and speed up user access to any particular page. The thumbnail graphics in the menubar were mostly real images cropped from digital photos. The 'moving effect' of the picture of the Norfolk Broads was achieved with a java applet applied to the actual picture, which occupied the top half. |
 |
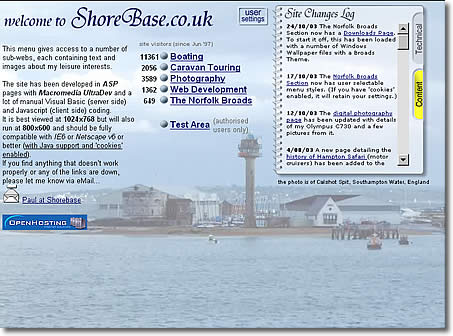 |
After the move to ASP pages in November 2000, the opening screen and base navigation were changed to this layout. As well as dynamic, database driven content, ASP enabled the use of 'Server Side Includes' which greatly enahnced the maintainability of the site. HTML code could be written 'on the fly' to generate complex HTML pages from short sections of server-side VB Code. 'Cookies' were enabled to track the individual section hit counters and allow users to specify their preferences for some of the menus etc. |
| The Norfolk Broads section was greatly expanded to include detailed maps, photos, boating links, a data-driven diary/calendar and a real-time tide calculator. | 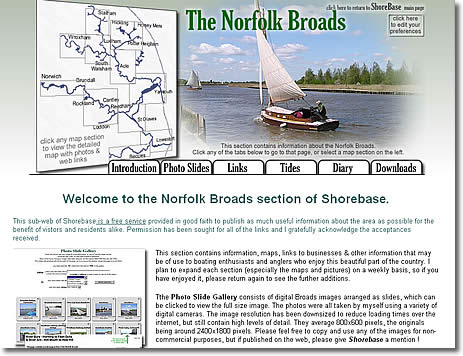 |
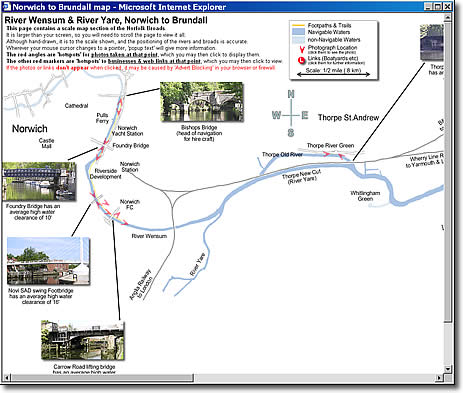 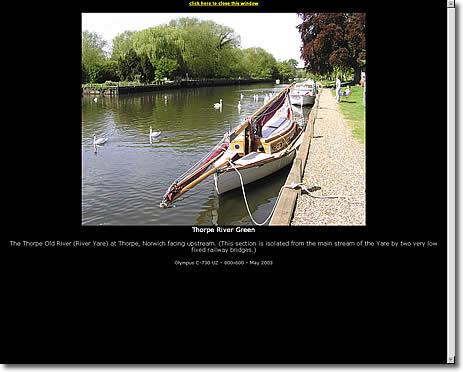 |
The map sections, covering the whole of the Norfolk Broads area, were hand drawn to give just the basic outline of the Rivers and Broads ( to a standard detailed, scale). In addition to static thumbnail images of the Bridges, they also have clickable areas to display either photographs or links to companies and businesses. Database driven, the map pages are written on demand by server side VB script functions that write the considerable (repetitive) html code for the photo descriptions and business link information. The photo and links data is stored in one central file, (maintainable online), to be viewed either by these maps or the dedicated links and photo pages. The red V markers indicate the angle and direction form which photos can be viewed when they are clicked, giving a sort of virtual reality tour of the area. When clicked, they bring up the full-size image in full screen mode against a black background. (except in Netscape!!) I find that this displays the photos to best advantage, without extraneous distractions. All of the photos were taken by myself, using the digital cameras shown in the photography section. I now have several thousand, taken throughout the year, as I am fortunate enough to live here. |
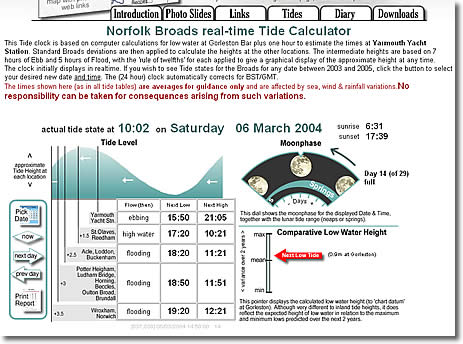 |
The Norfolk Broads,
being flat, are affected by tides far more than most inland rivers, and
the state of tide (high or low) varies by as much as 4 hours depending
on how far you are from the sea. The
Tide calculator page written in server side VB script, calculates
and displays the approximate tide heights at key locations for any point
in time during the current 3 year window. As a datum, it calculates the
low water at Gorelston Bar, then applies standard local deviations to
give the intermediate heights. The graphic 'sinewave' is achieved by the
calculated left position of its layer behind a window in a white background
image layer.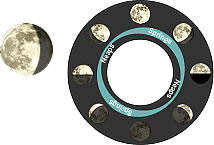 The combined moonphase and spring/neap tide indicator is a disk which rotates 1/29 of 360° per day. The sunrise, sunset, moonphase and springs/neaps are calculated directly from the date via standard astronomical formulae. |
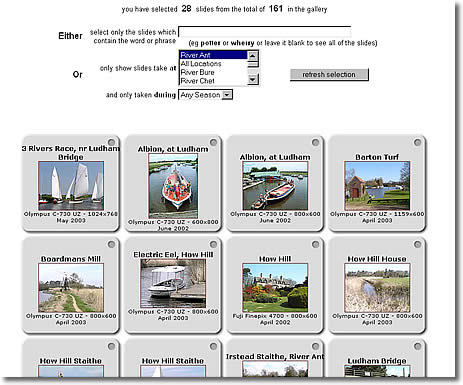 |
The slide viewer page (for the Broads), (working the same way as the digital photos page and the old photos page is generated by server side VBscript from the database. Depending on the visitors selections, the slide records write the file names, descriptions etc. into a table with the maximum number of cells across that the current window can accomodate. The slide outlines are created from a single cell background image, with the text and thumbnail placed upon each. A client-side javascript function then loads the full size image into a new window when the thumbnail is clicked. The server side asp page is therefore quite small, and contains none of the extensive text, which all comes from the database. |